Scatter plots of data
Context: Common qualifiers
Introduction
There are four qualifiers which together define a scatter plot
of data. If several plots are required, the sets if these qualifiers
be placed on separate lines.
!X xvar !Y yvar !G groups !JOIN
is used to plot the (transformed) data.
xvar
is the variable plotted on the X axis.
yvar
is the variable plotted on the Y axis.
groups
is a grouping variable, and
!JOIN
joins the points when the xvar value increases between
consecutive records.
The grouping variable may be omitted for a simple scatter plot.
Omit
!Y yvar
to produce a histogram of the xvar variable.
Note that the graphs are only produced in the graphics versions of
ASReml.
Example
!X age !Y height !G sex
produces a trellis plot of
height
versus
age
with separate panels for each level of the factor
sex.
Response profiles
For multivariate repeated measures data, ASReml can plot the response
profiles if the first response is nominated with the
!Y
qualifier
and the following analysis is of the multivariate data. ASReml assumes
the response variables are in contiguous fields and are equally spaced.
Example
 Response profiles
  Treatment !A
  Y1 Y2 Y3 Y4 Y5
 rat.asd  !ASUV
  !Y Y1 !G Treatment !JOIN
 Y1 Y2 Y3 Y4 Y5 ~ Trait Treatment Trait.Treatment
 residual units.ante1(Trait)
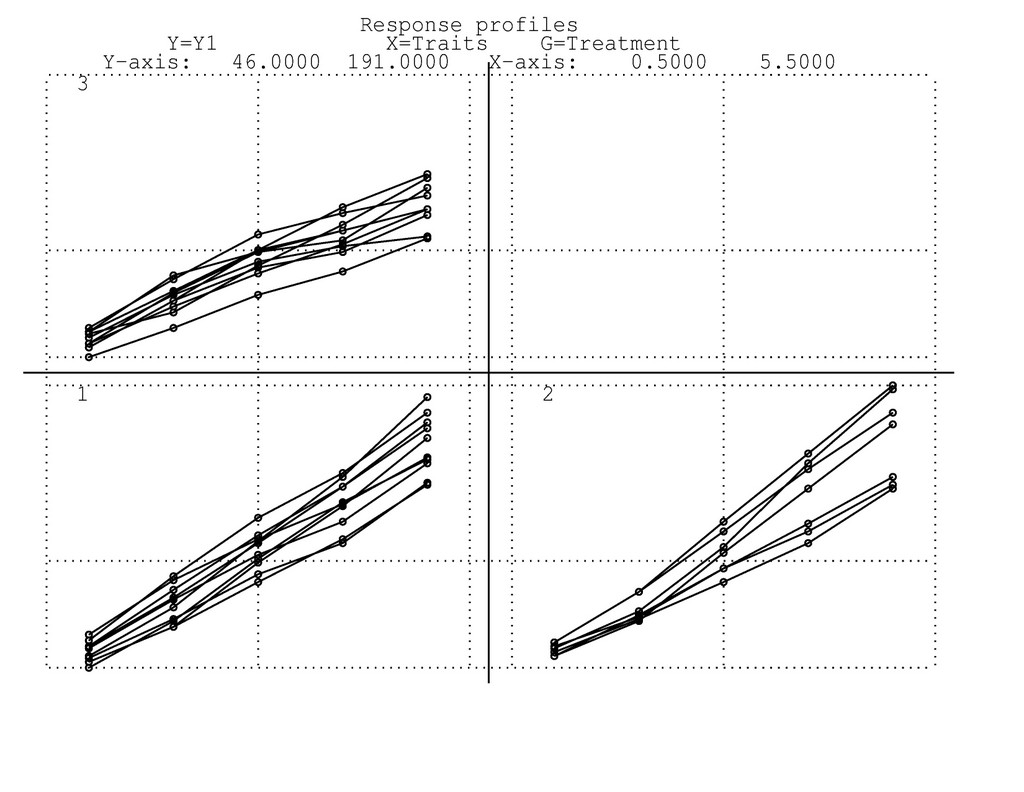
Figure 1 Trellis plot of rat growth
Back to general qualifiers
Return to index